Devices that transmit in the 433-435Mhz ISM band are some of the most prevalent in modern society. From key fobs to temperate sensors and smoke detectors, devices in this band are heavily used and are increasingly being combined with the Internet of Things (IOT). The security of these devices varies with some implementing security through rolling codes and encoding, whilst other devices freely transmit in the clear relying on security through obscurity.
War Driving is a technique that is typically associated with identifying Wireless Access points in the 2.4Ghz and 5Ghz range. This project takes the idea of War Driving and applies it to devices operating in the 433Mhz range through the use of a Heat Mapping technique and decoding of signals.
Equipment and Software Used
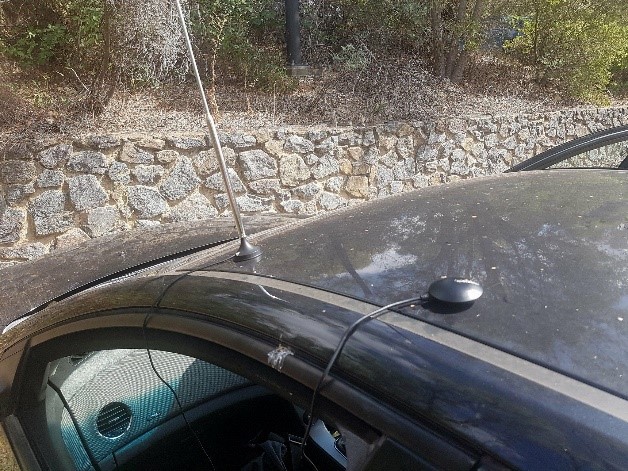
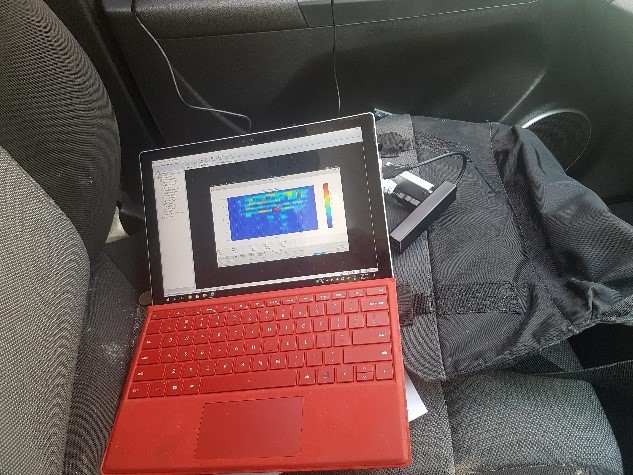
The following equipment was used during the project:
- RTL-SDR
- Extendible Whip Antenna
- GlobalSat BU-353 G-STAR IV High-Sensitivity GPS Receiver
- Microsoft Surface Pro 4
The following software was used during the project:
- Kali Linux 2018.1
- RTLSDR Scanner
- Tautology’s Heat Map Script
- Python
- Google Maps API
- rtl_433
Methodology
Due to the sporadic nature in which Key Fobs and other similar devices function it was determined that a control heat map was required to ensure that the process would work and generate a useable heat map. This was also required as there was no evidence online of anyone creating a workable Heatmap as described by a user known as Tautology in a post on Reddit (“GSM heatmap using RTL-SDR • r/RTLSDR”, 2014).
The initial signal of interest was a local Canberra radio station 104.7 which produced the following heat map.
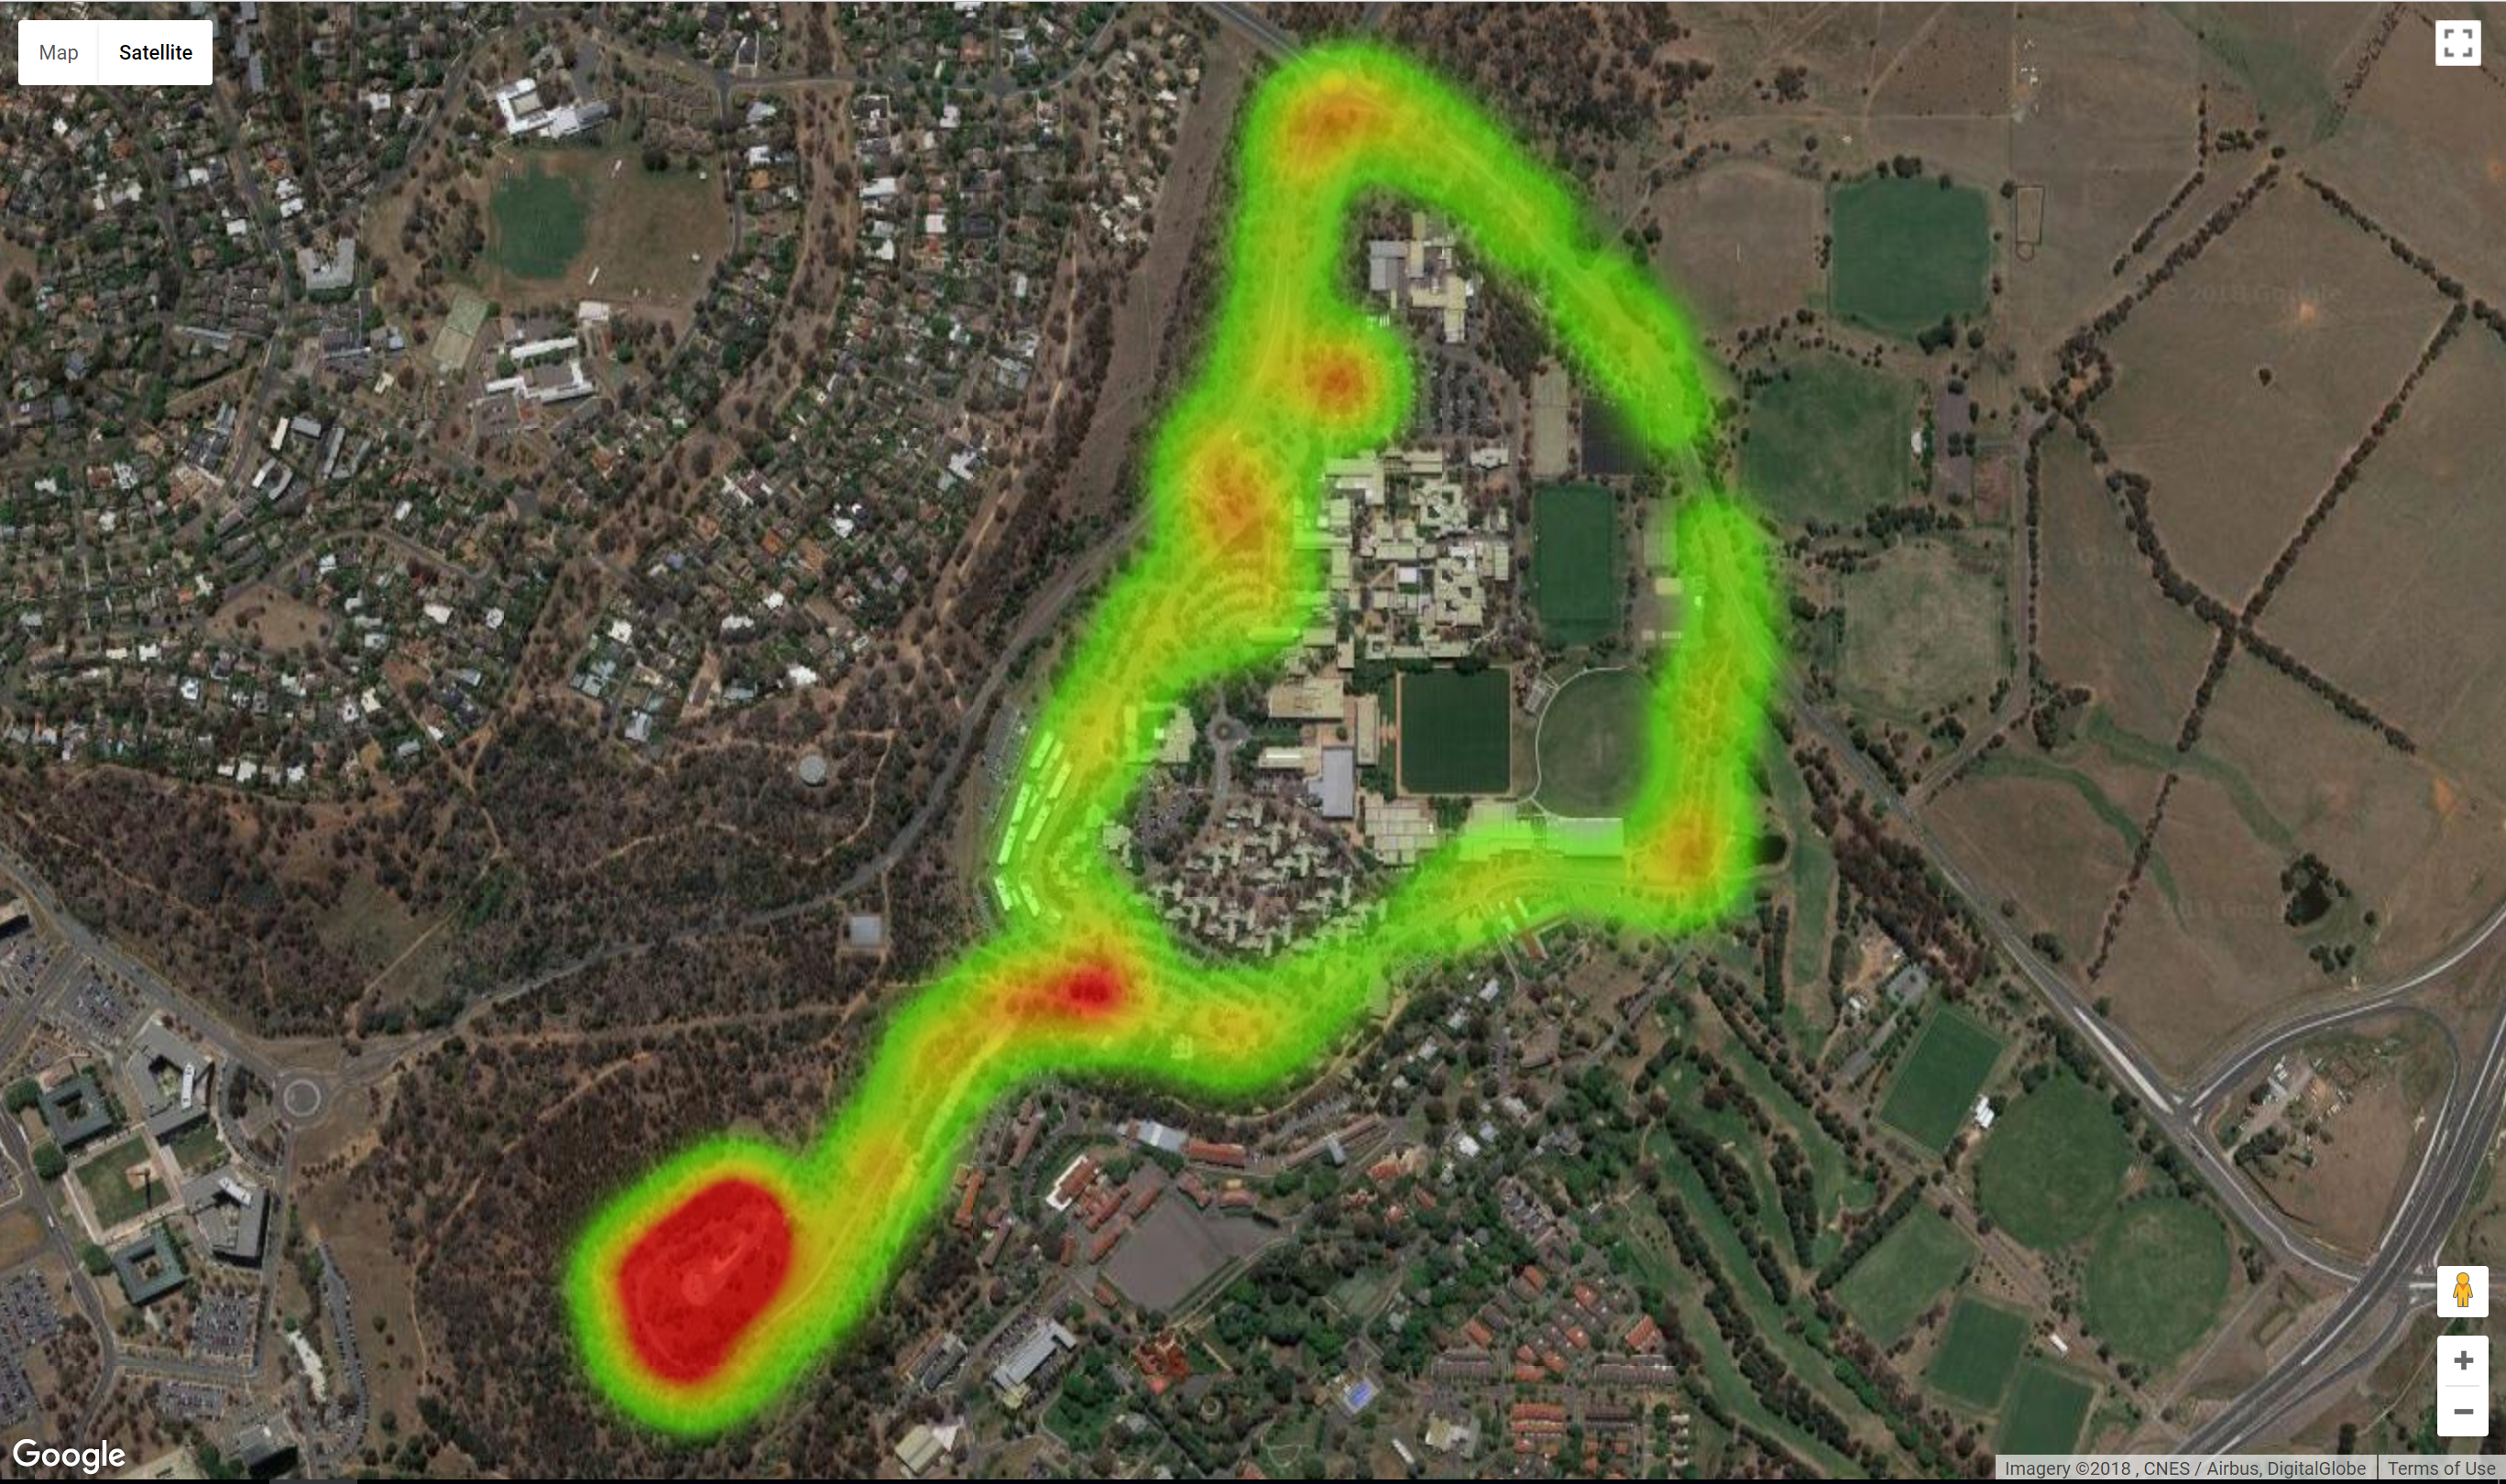
Using local knowledge of the location of the transmitter and some basic terrain analysis it was determined that the heat map produced was accurate and that accurate results when scanning 433-435Mhz were to be expected.
The process to produce the heatmap involved conducting a GPS enabled scan in RTL Scanner and saving the data as a .rfs file. The .rfs file is then passed to Tautology’s ruby script ‘single_band2web.rb’. This script normalizes data (removing duplicate location data within 10m) and then produces a series of latitude, longitude and signal strength readings in JSON format. I then wrote my own python script to parse the JSON data into the format required by Google Maps and then placed that data inside my own custom Google Maps .html file.
The next step was to scan the 433-435Mhz band with RTL Scanner. I decided to do this in my own suburb as it is a low density, semi-rural environment and is expected to have a lower RF signature and therefore less noise compared to a higher density urban environment.
In order to ensure signals were not missed, I drove at approx. 20km/h around the village which was only achievable due to the low volume of traffic in the area. Whilst this approach ensured a greater collection of RF traffic, it also raised the suspicions of locals in the area.
The following heat map was produced from a scan of 433-435Mhz.
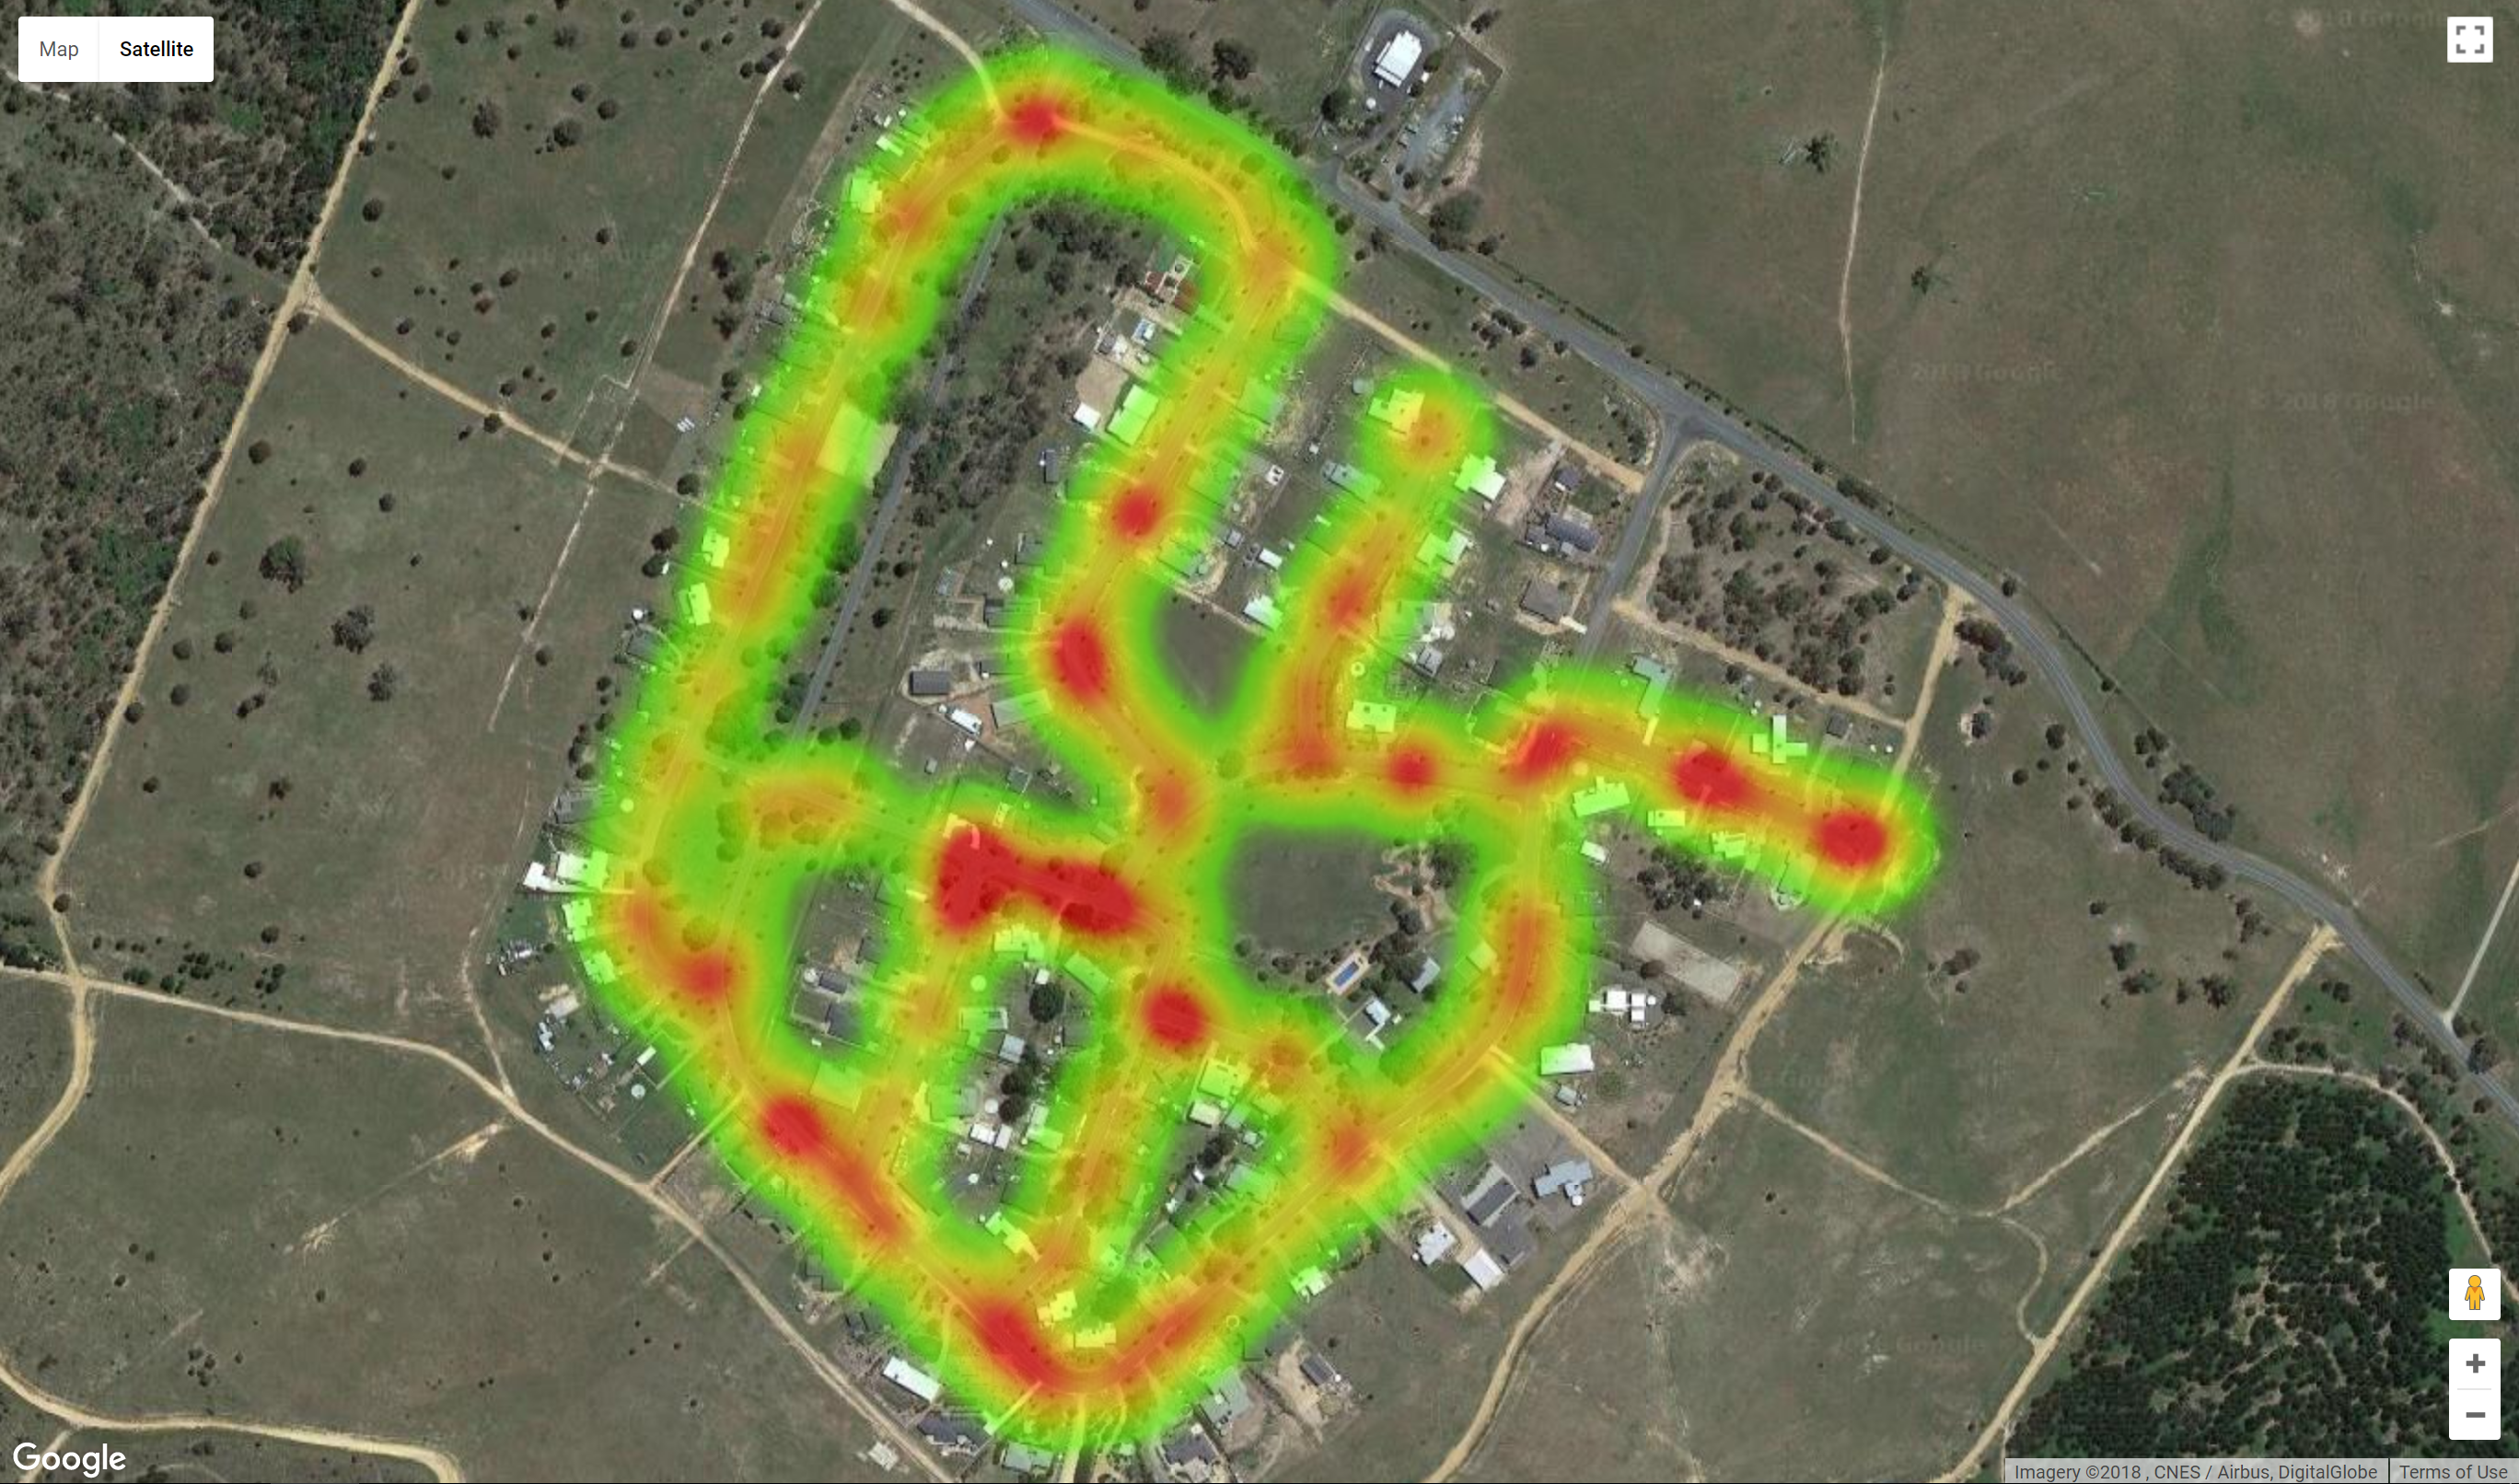
The results were a surprise, as known 433Mhz receivers only appeared orange in colour and there were significant ‘red zones’ across the map. To confirm these results, I conducted a second drive, stopping at each of the red zones and running rtl_433 to see what appeared. This confirmed the accuracy of the heat map as these ‘red zones’ generated significant traffic on the 433.92Mhz frequency due to a large number of devices in these areas.
Observations
After confirming the accuracy of the 433Mhz heat map, I wanted to find out what devices were in the ‘red zones’. To do this I completed the same circuit around the suburb using rtl_433 to receive traffic. Over 150 433Mhz pulses were detected during a 8 minute drive around the suburb.
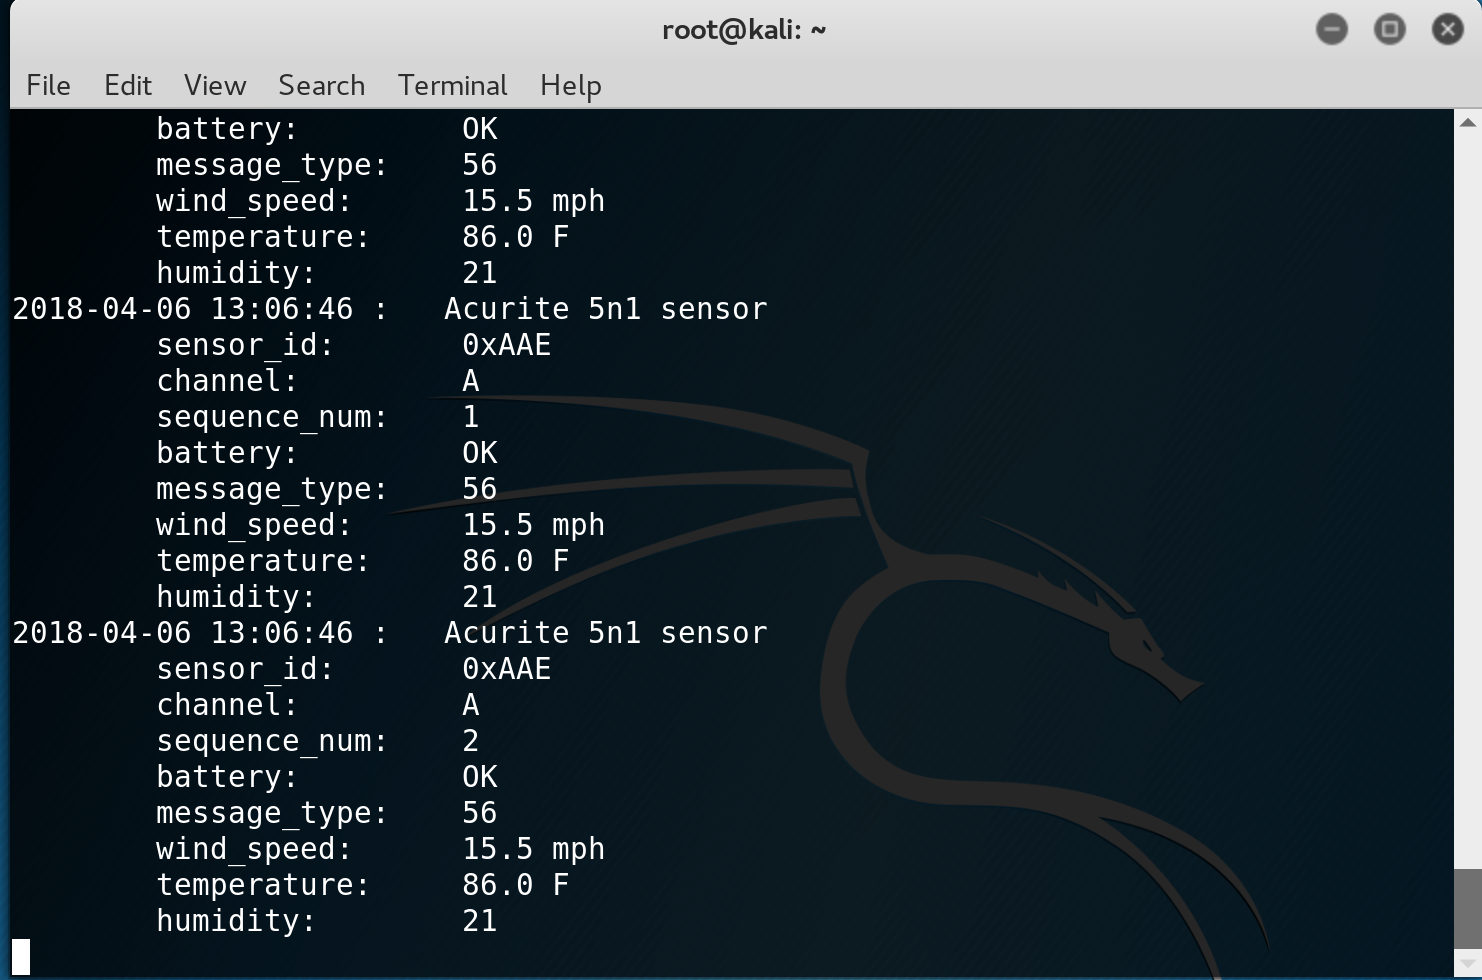
rtl_433 was able to decode 11 different devices and produced the following statistics:
| Device | Number |
|---|---|
| Fine Offset Electronics WH1080/WH3080 Weather Station | 5 |
| Acurite 5n1 sensor Weather Station | 4 |
| CurrentCost Power Usage Monitor | 4 |
| Oregon Scientific THGR968 Wireless Thermometer | 1 |
| inFactory Temperature and Humidity Sensor | 2 |
| Oregon Scientific SL109H Wireless Temperature and Humidity Sensor | 1 |
| Philips outdoor temperature sensor | 1 |
| Acurite Rain Gauge | 1 |
| OSv1 Temperature Sensor | 1 |
| Interlogix Key Fob | 1 |
| Smoke detector GS 558 | 1 |
Analysis
The list of decoded devices is limited to what is built in to rtl_433 and noting that there were over 150 433Mhz pulses and only 22 devices were identified indicates that there are more devices transmitting in the area that were not able to be confirmed within the timeframe of the project.
The high number of weather stations is to be expected as the area is on tank water only and therefore monitoring rain levels is important for managing tank water supply.
All decoded devices had no encryption or coding, which makes these devices vulnerable to manipulation and replay attacks.
Threats
Although attacking weather station data may seem benign, there are some social threats that could be exploited through manipulating this data. The following details some examples of the impacts of manipulating weather and power meter data:
- Manipulation of rain gauge readings may cause residents to believe there is more water in their tanks than they believe. Therefore, they do not order additional water and run out.
- Manipulation of Power Meter readings may cause a resident to believe they have power problems and spend additional time and resources fault finding.
- Manipulation of Power Meter readings may cause a resident to cease using their air-conditioning or heating in order to save electricity.
- Manipulation of Smoke Detector readings may trigger a house’s internal fire sprinkler system.
Additionally, elements of these devices may be used in industrial or commercial systems making these vulnerable to a manipulation or replay attack
Defences
Defensive measures for protecting against the identified threats are already implemented in a wide range of key fobs for garage doors and cars. The use of rolling codes between sensor and receiver will prevent/make it difficult for any attack to occur on 433Mhz devices.
Future Development
The concept of wardriving the 433Mhz spectrum is not well researched with minimal information available online. To further develop this project it is proposed that a fork of the program rtl_433 be created and GPS location data be added through the GPSD service in Linux. To improve location accuracy signal strength data will also need to be included into the new program.
Conclusion
The analysis of 433Mhz devices is an interesting area of study and this project has proven that war driving for 433Mhz devices is not just looking for opportunistic key fob activations. There are a significant number of static, household devices that are regularly transmitting data without any security mechanisms in place. This data can easily be intercepted, manipulated and replayed in order to manipulate a target or benefit the attacker.